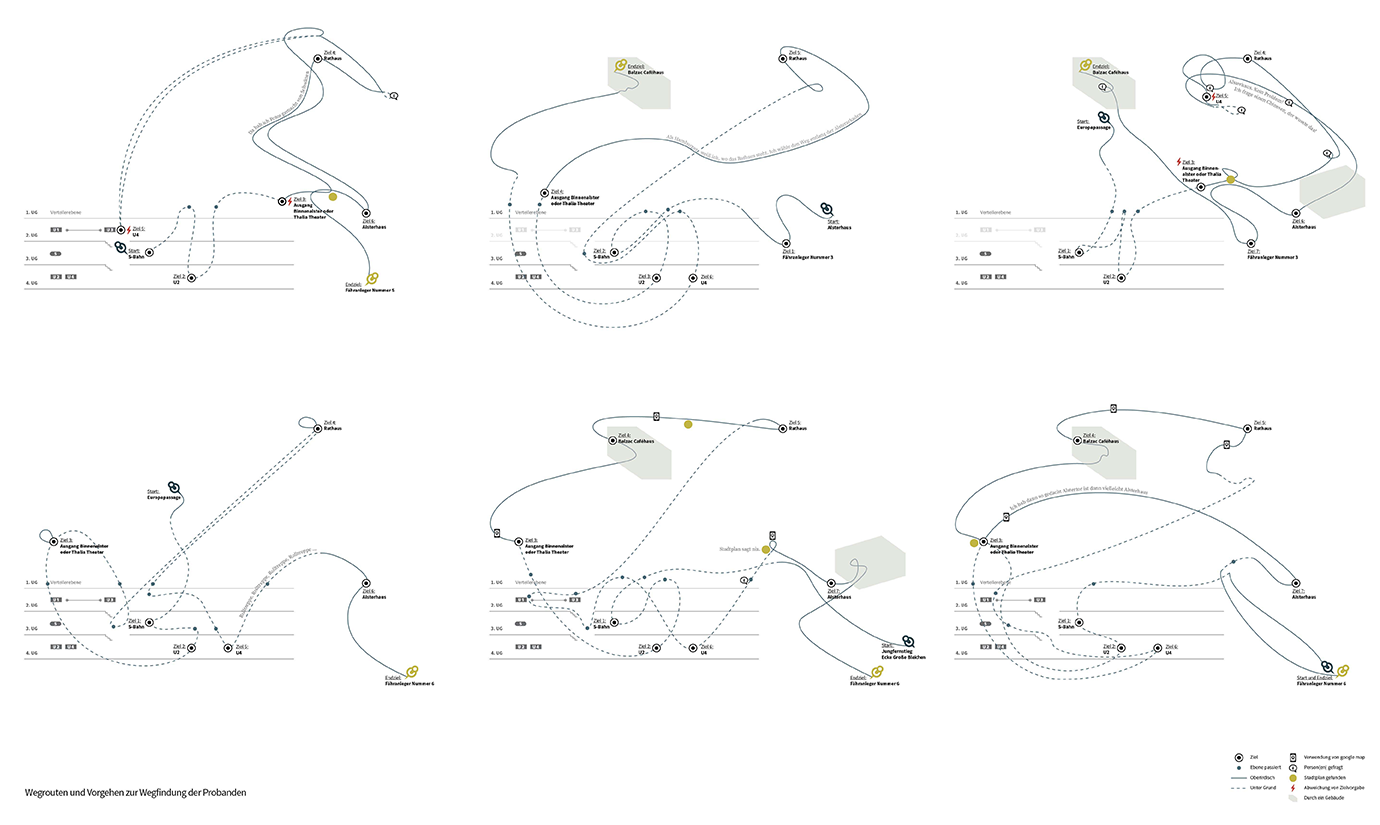
Directions and methods of probands for finding the way in my thesis about wayfinding systems.
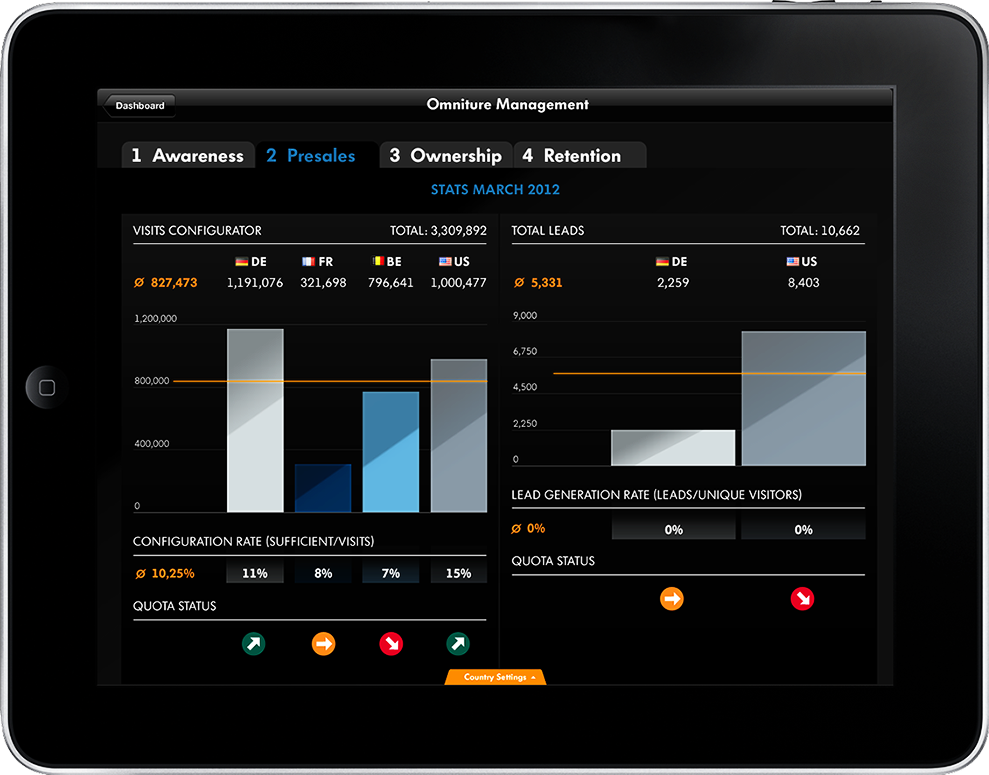
A tablet application giving insights to sales agents.
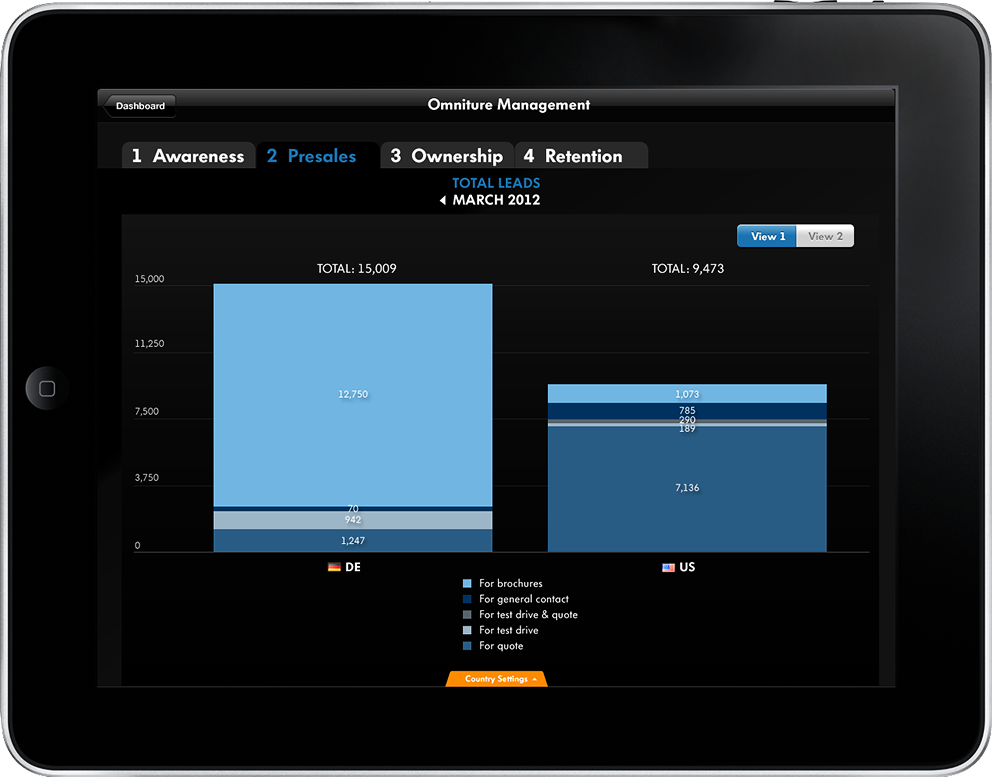
A tablet application giving insights to sales agents.
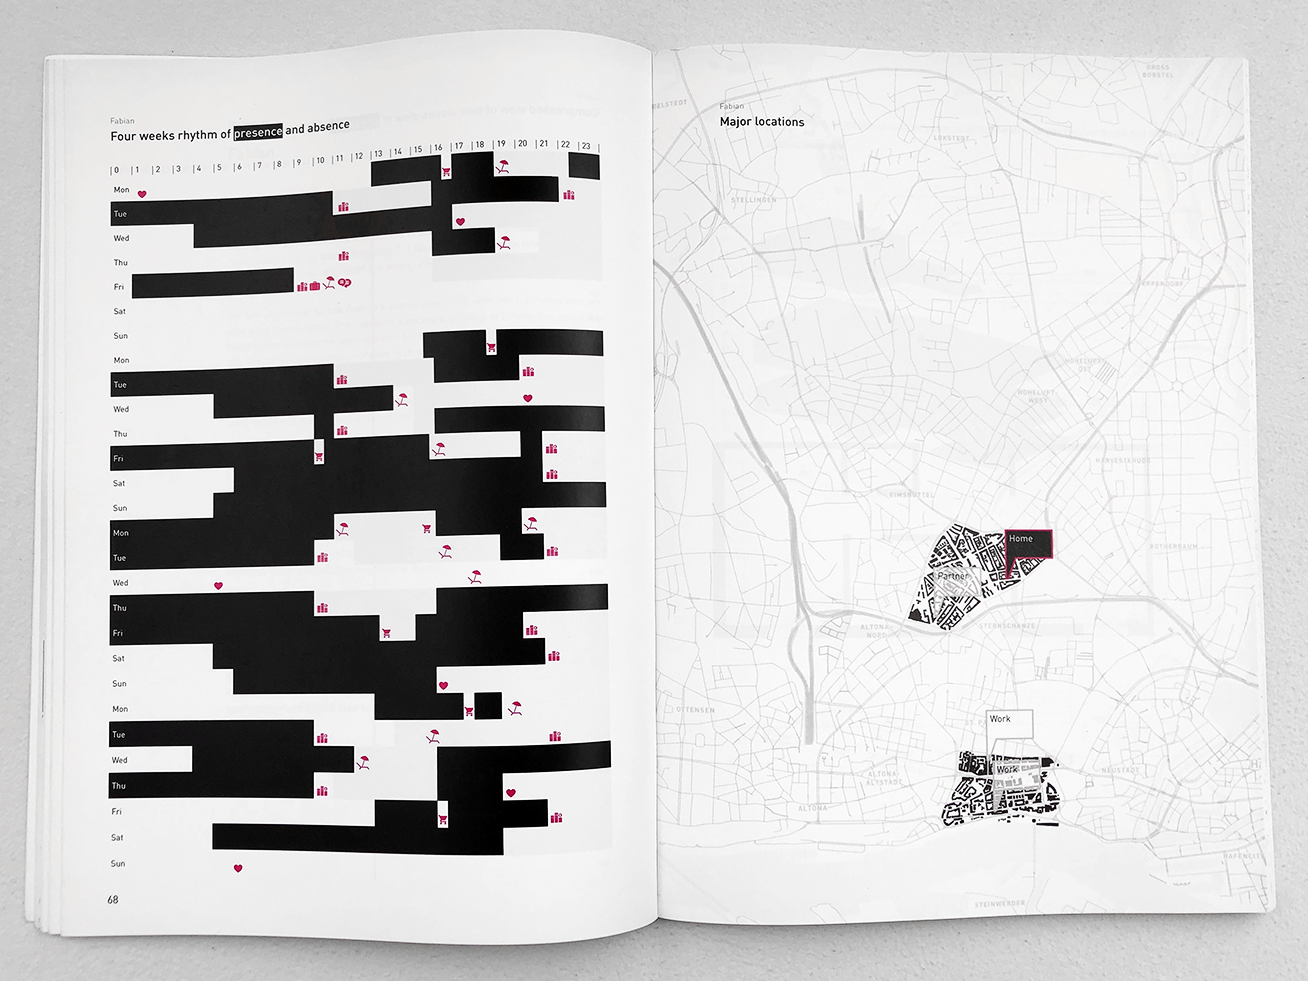
Graphical representation of a monthly and daily spatial movement of a person.
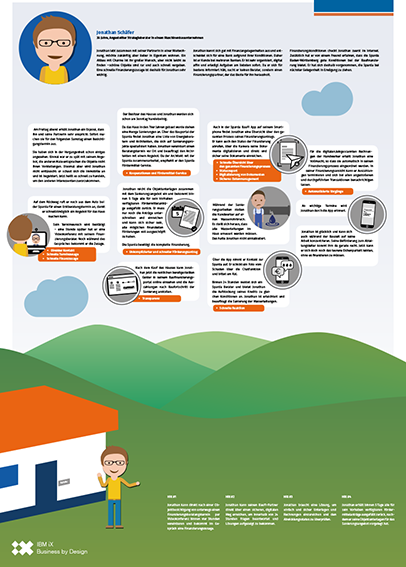
Customer Journey for a bank.
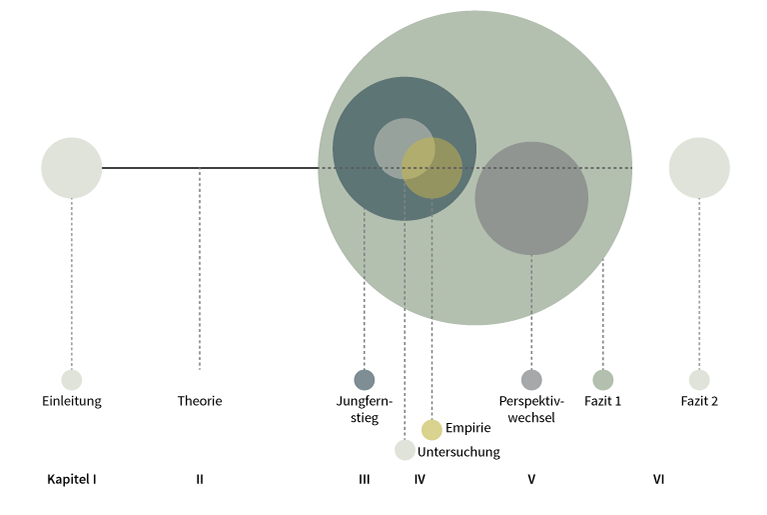
Graphical representation of the process until completion of the thesis.
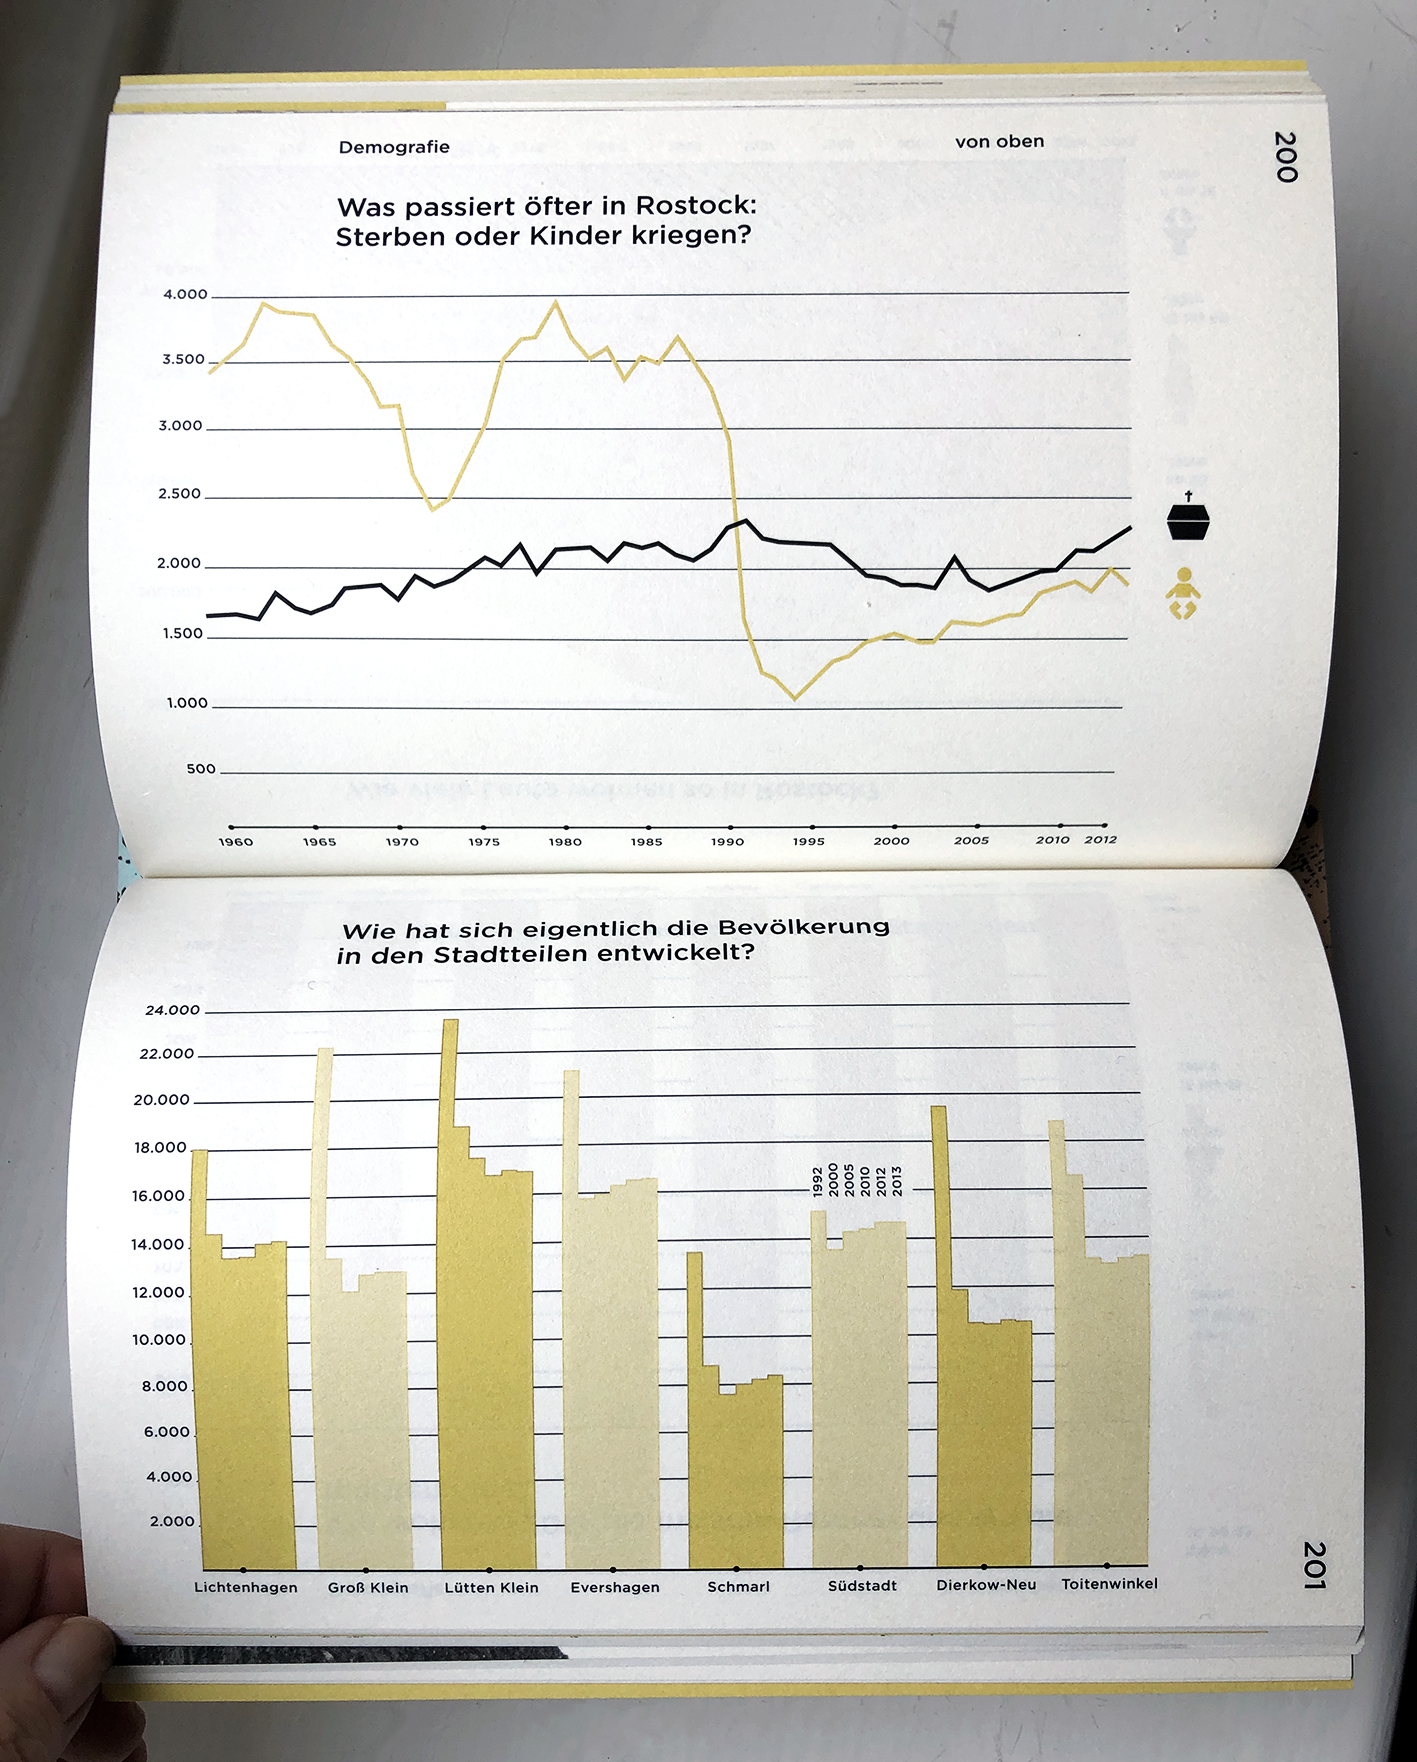
Extract from the study on Rostock's districts.
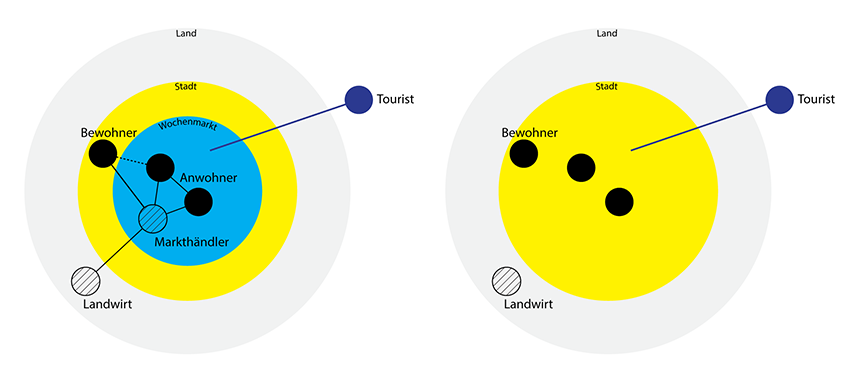
Effect of weekly markets on stakeholders within the city.
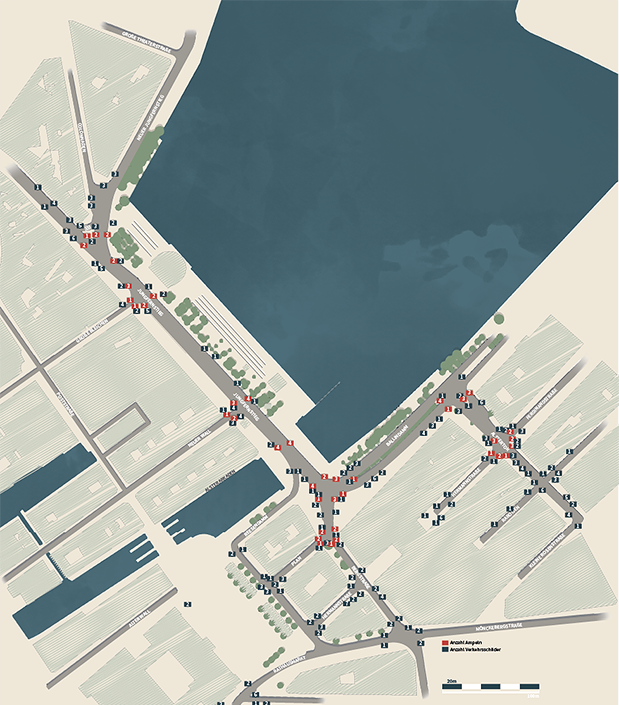
Analysis on traffic and other urban signage around Jungernstieg Hamburg.
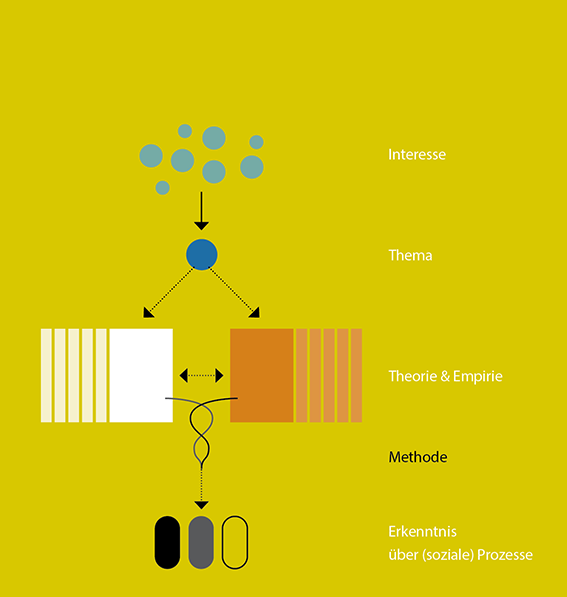
Design approach in urban design.
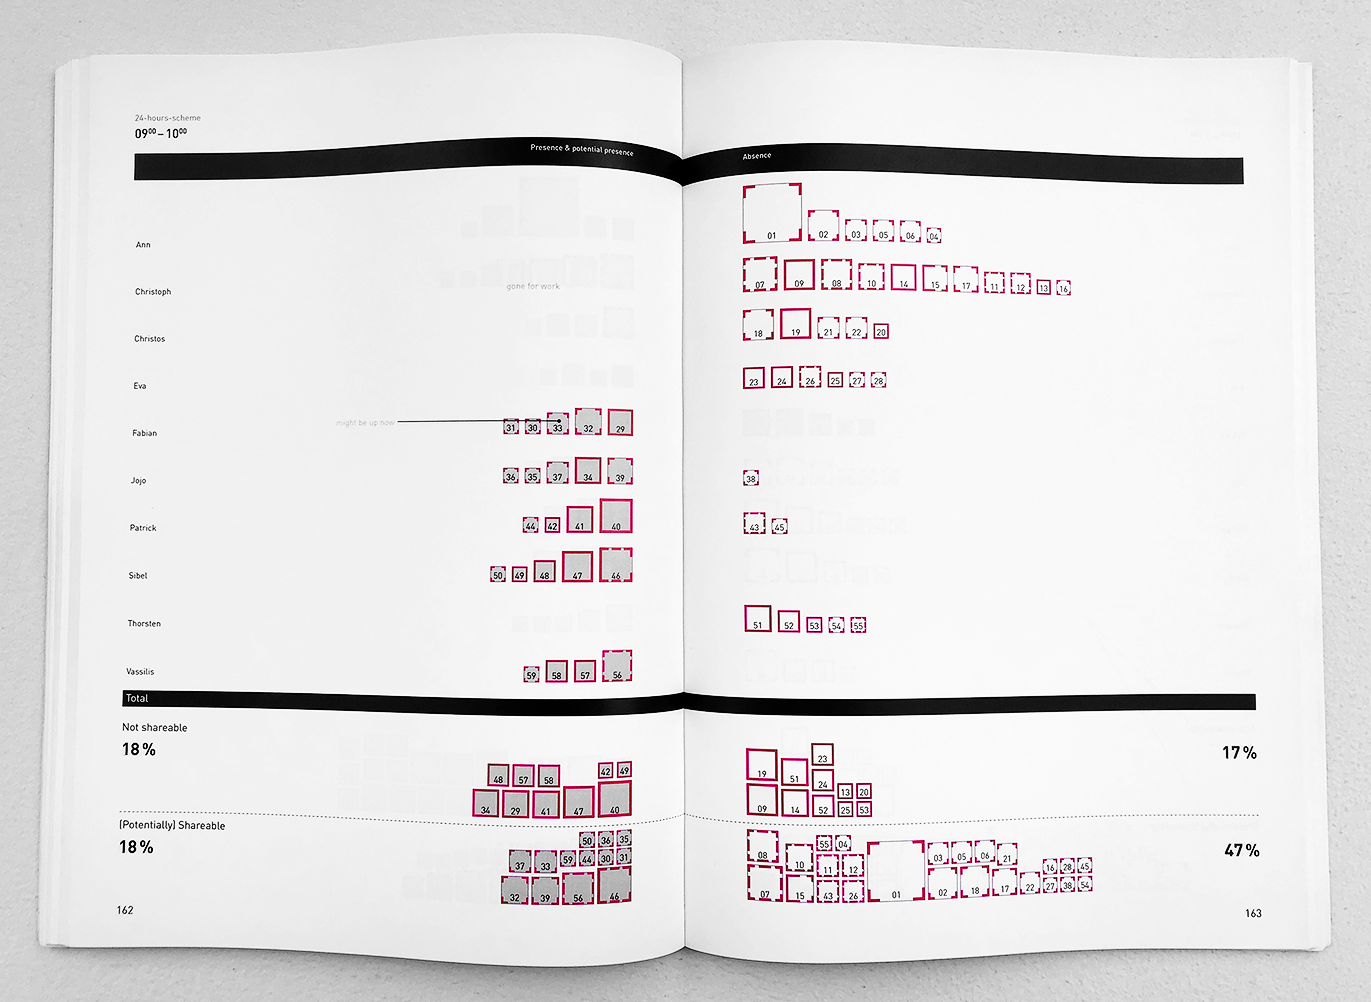
Research analysis in terms of living space and the willingness of the residents to share certain spaces.
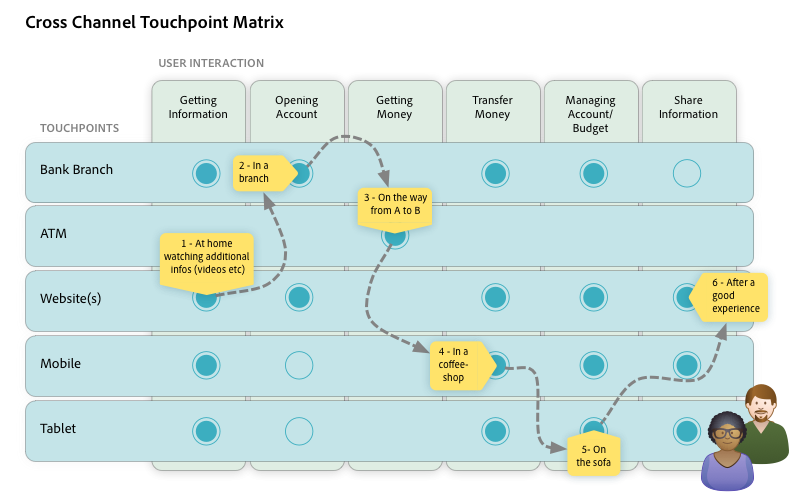
Displaying touchpoints of a banking customer.

A dashboard for sales representatives in the automotive industry that gives insights into the use of the online configurator.
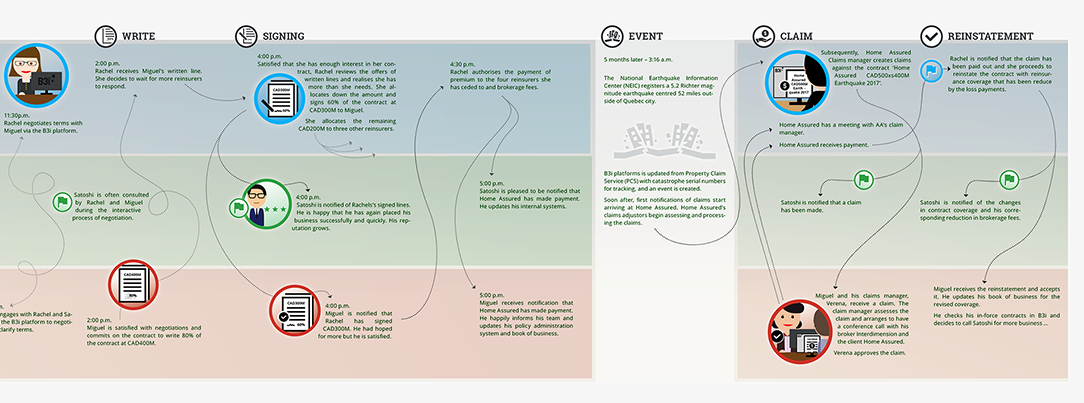
The journey of different stakeholders in the reinsurance industry as a tool to attract future clients and to align with the development team on a blockchain service.
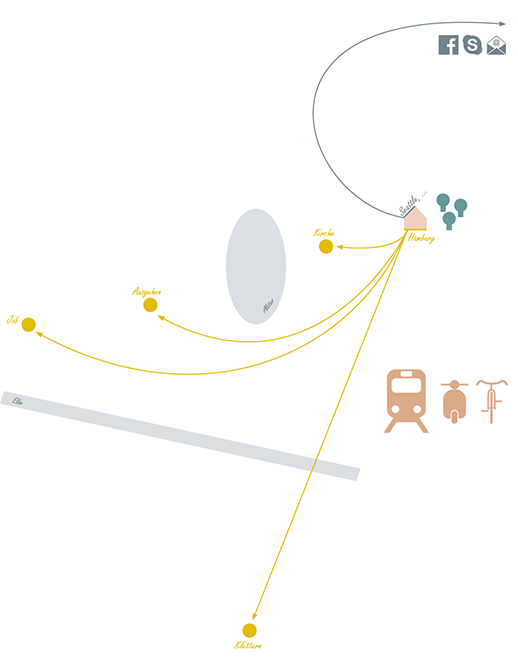
Graphical representation of a person's radius of movement and his mobility options.
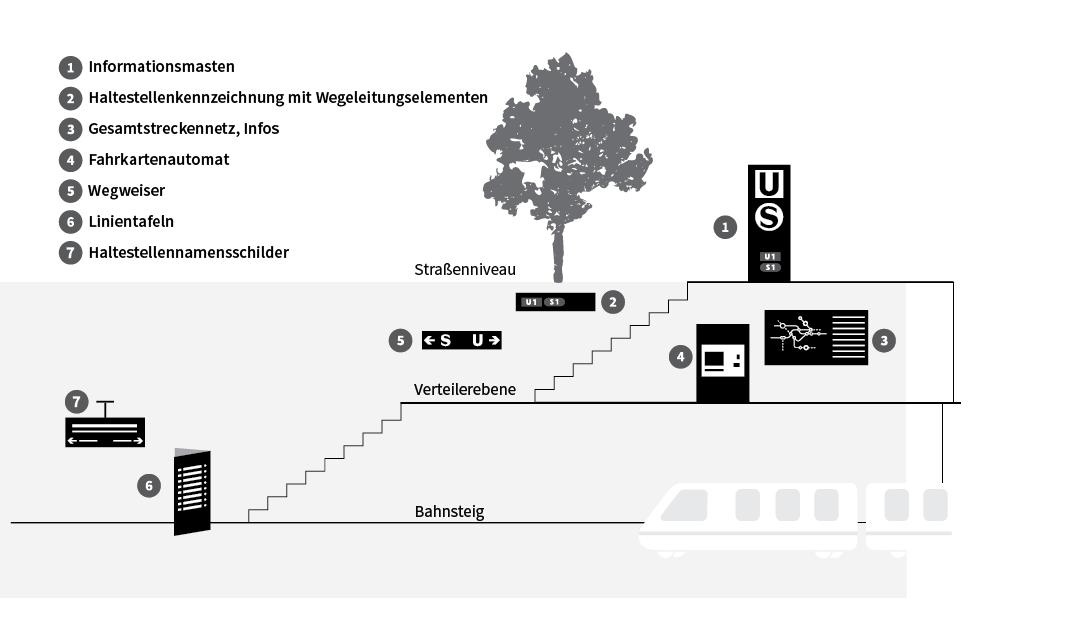
Graphical analysis of public transport signage on the way to a station.
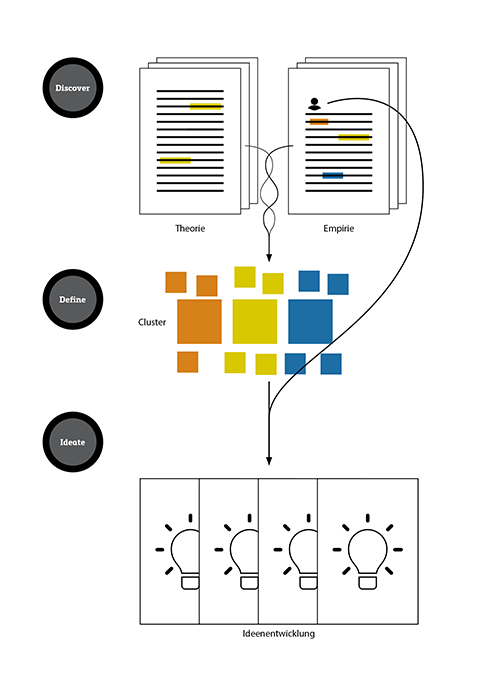
Research process in Urban Design.
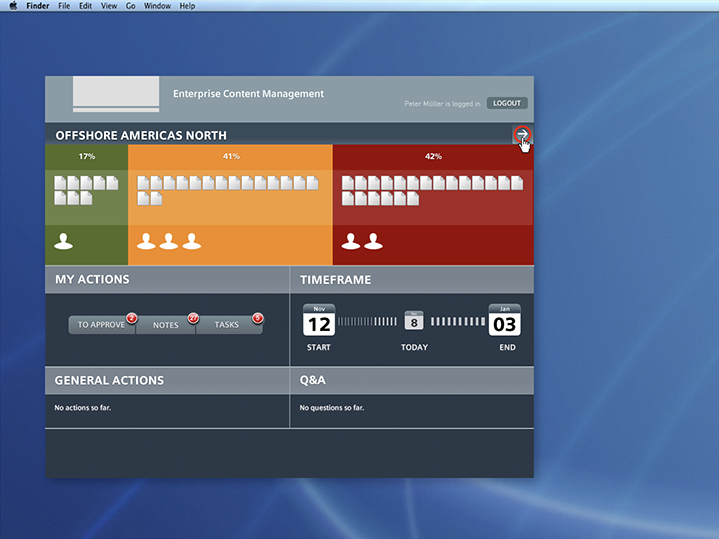
A prototype for an application that gathers treaties and simplifies complex tendering.
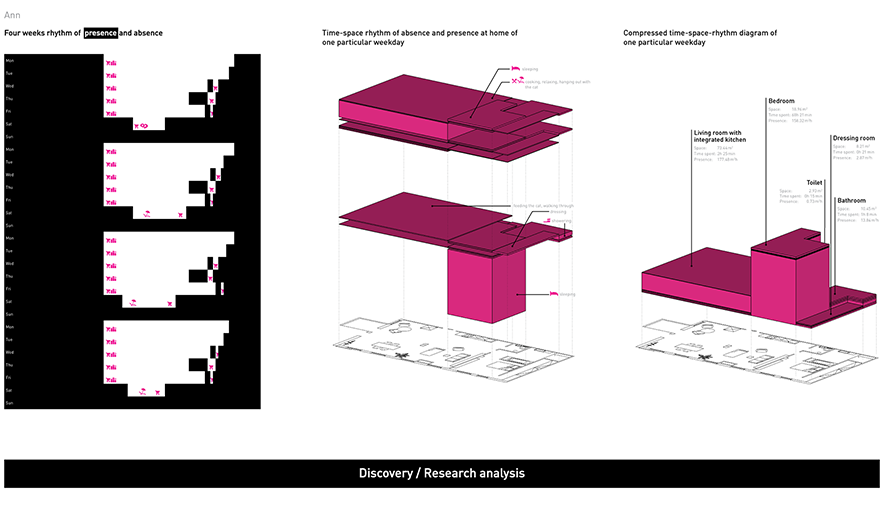
Discovery phase to explore how, when and what is used in relation to housing.
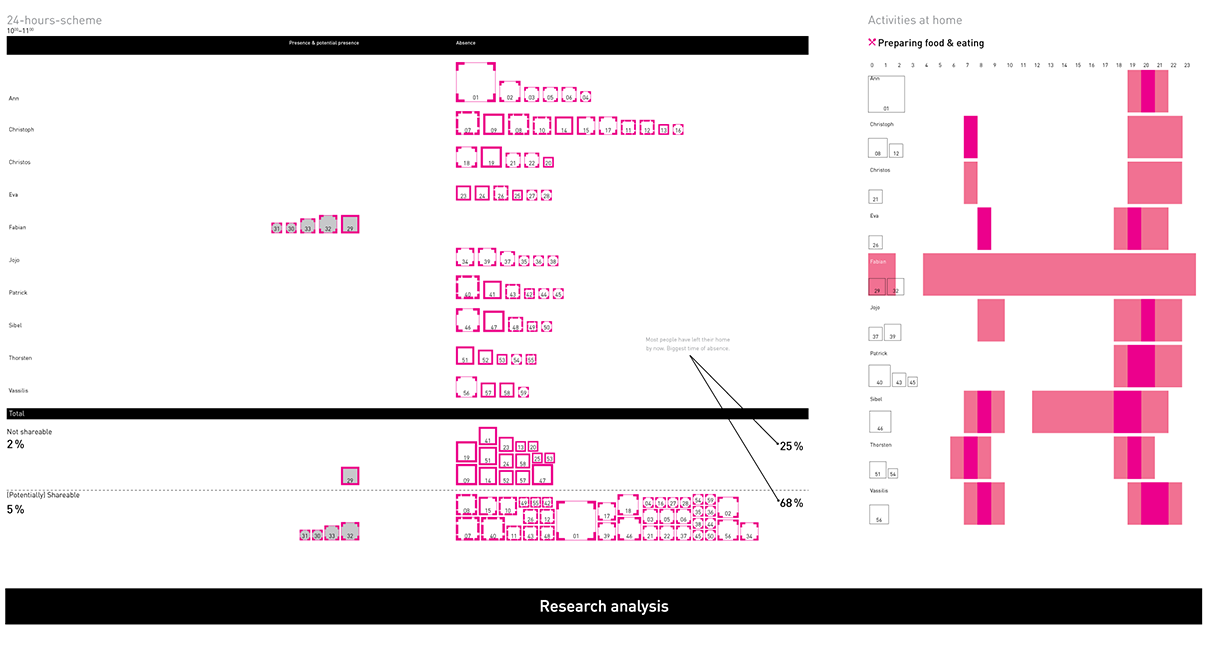
Research analysis in terms of living space and the willingness of the residents to share certain spaces.
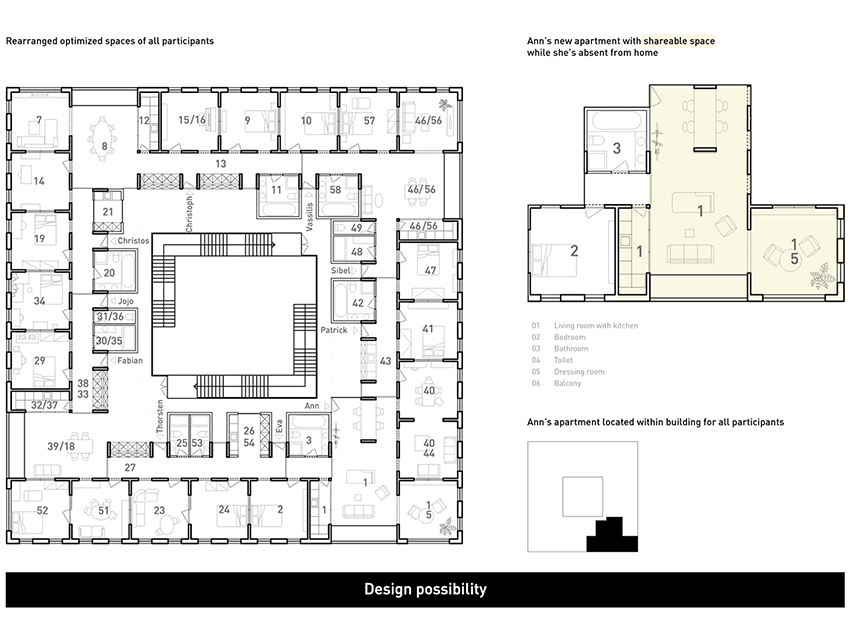
Design possibility for a research on the subject of dwelling.
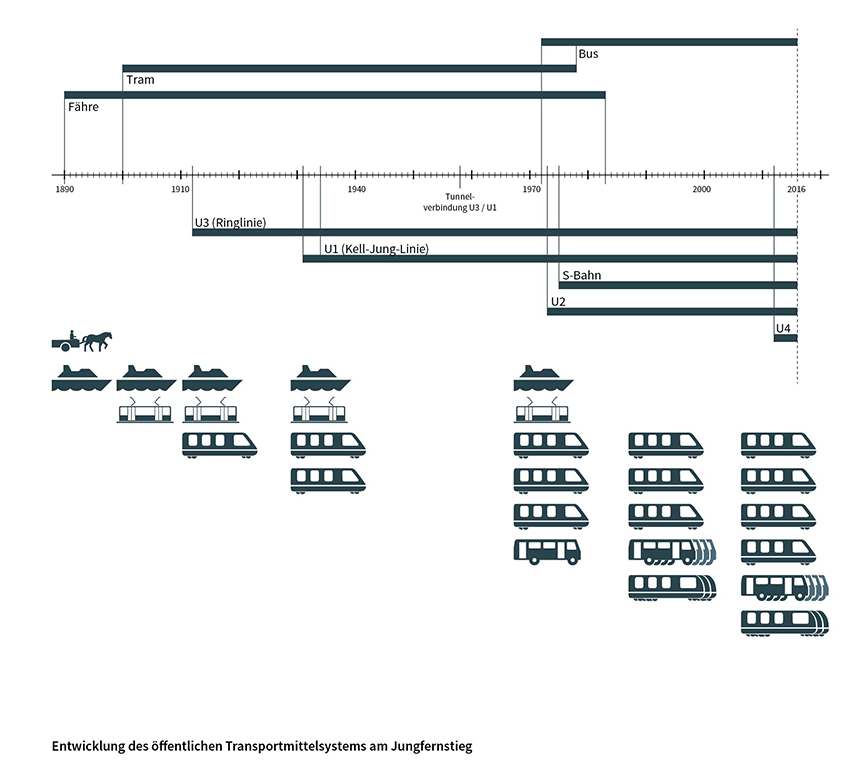
Visualization of the development of public transport in Hamburg over time.
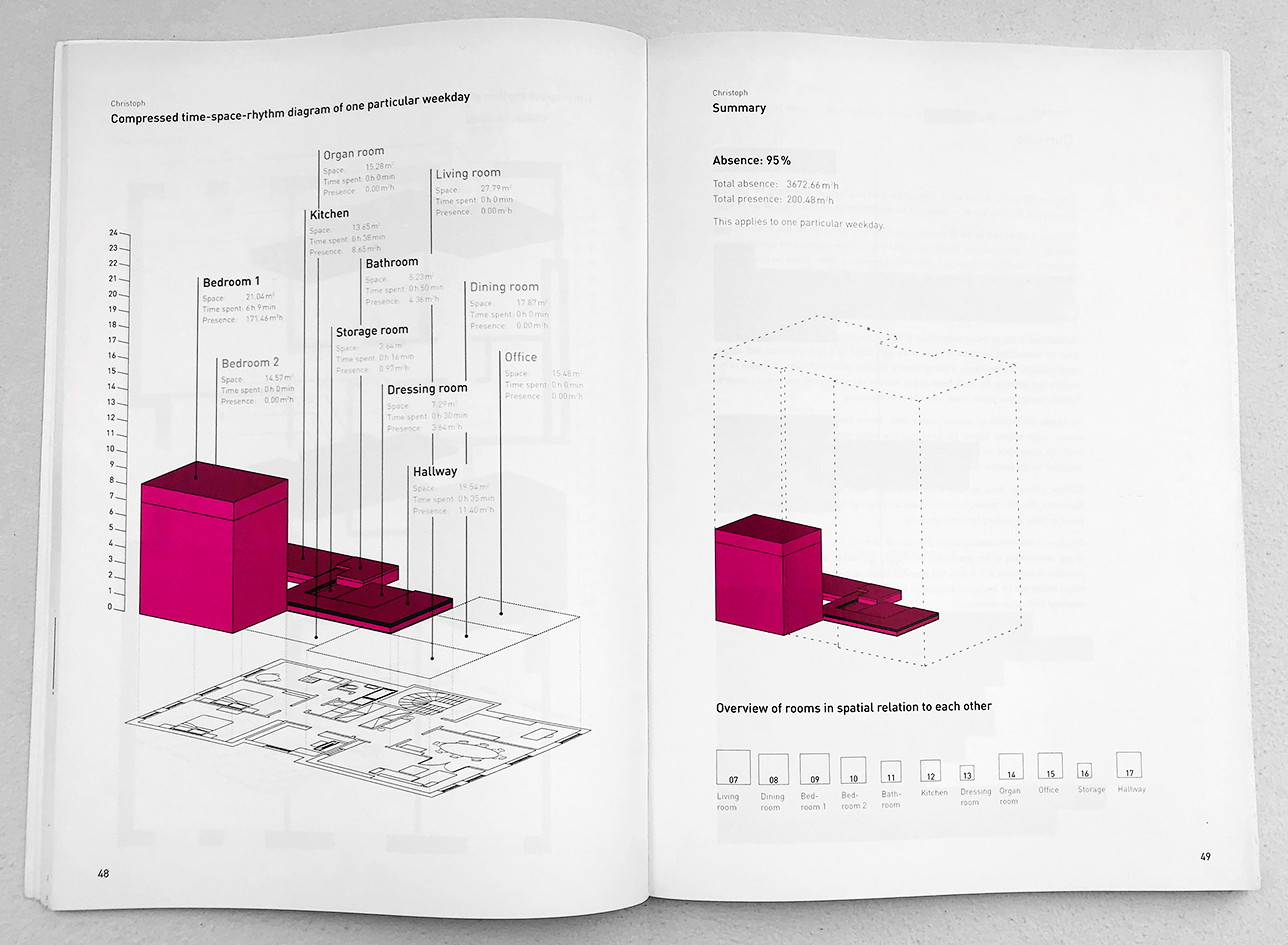
Display of the time spent in specific living spaces.
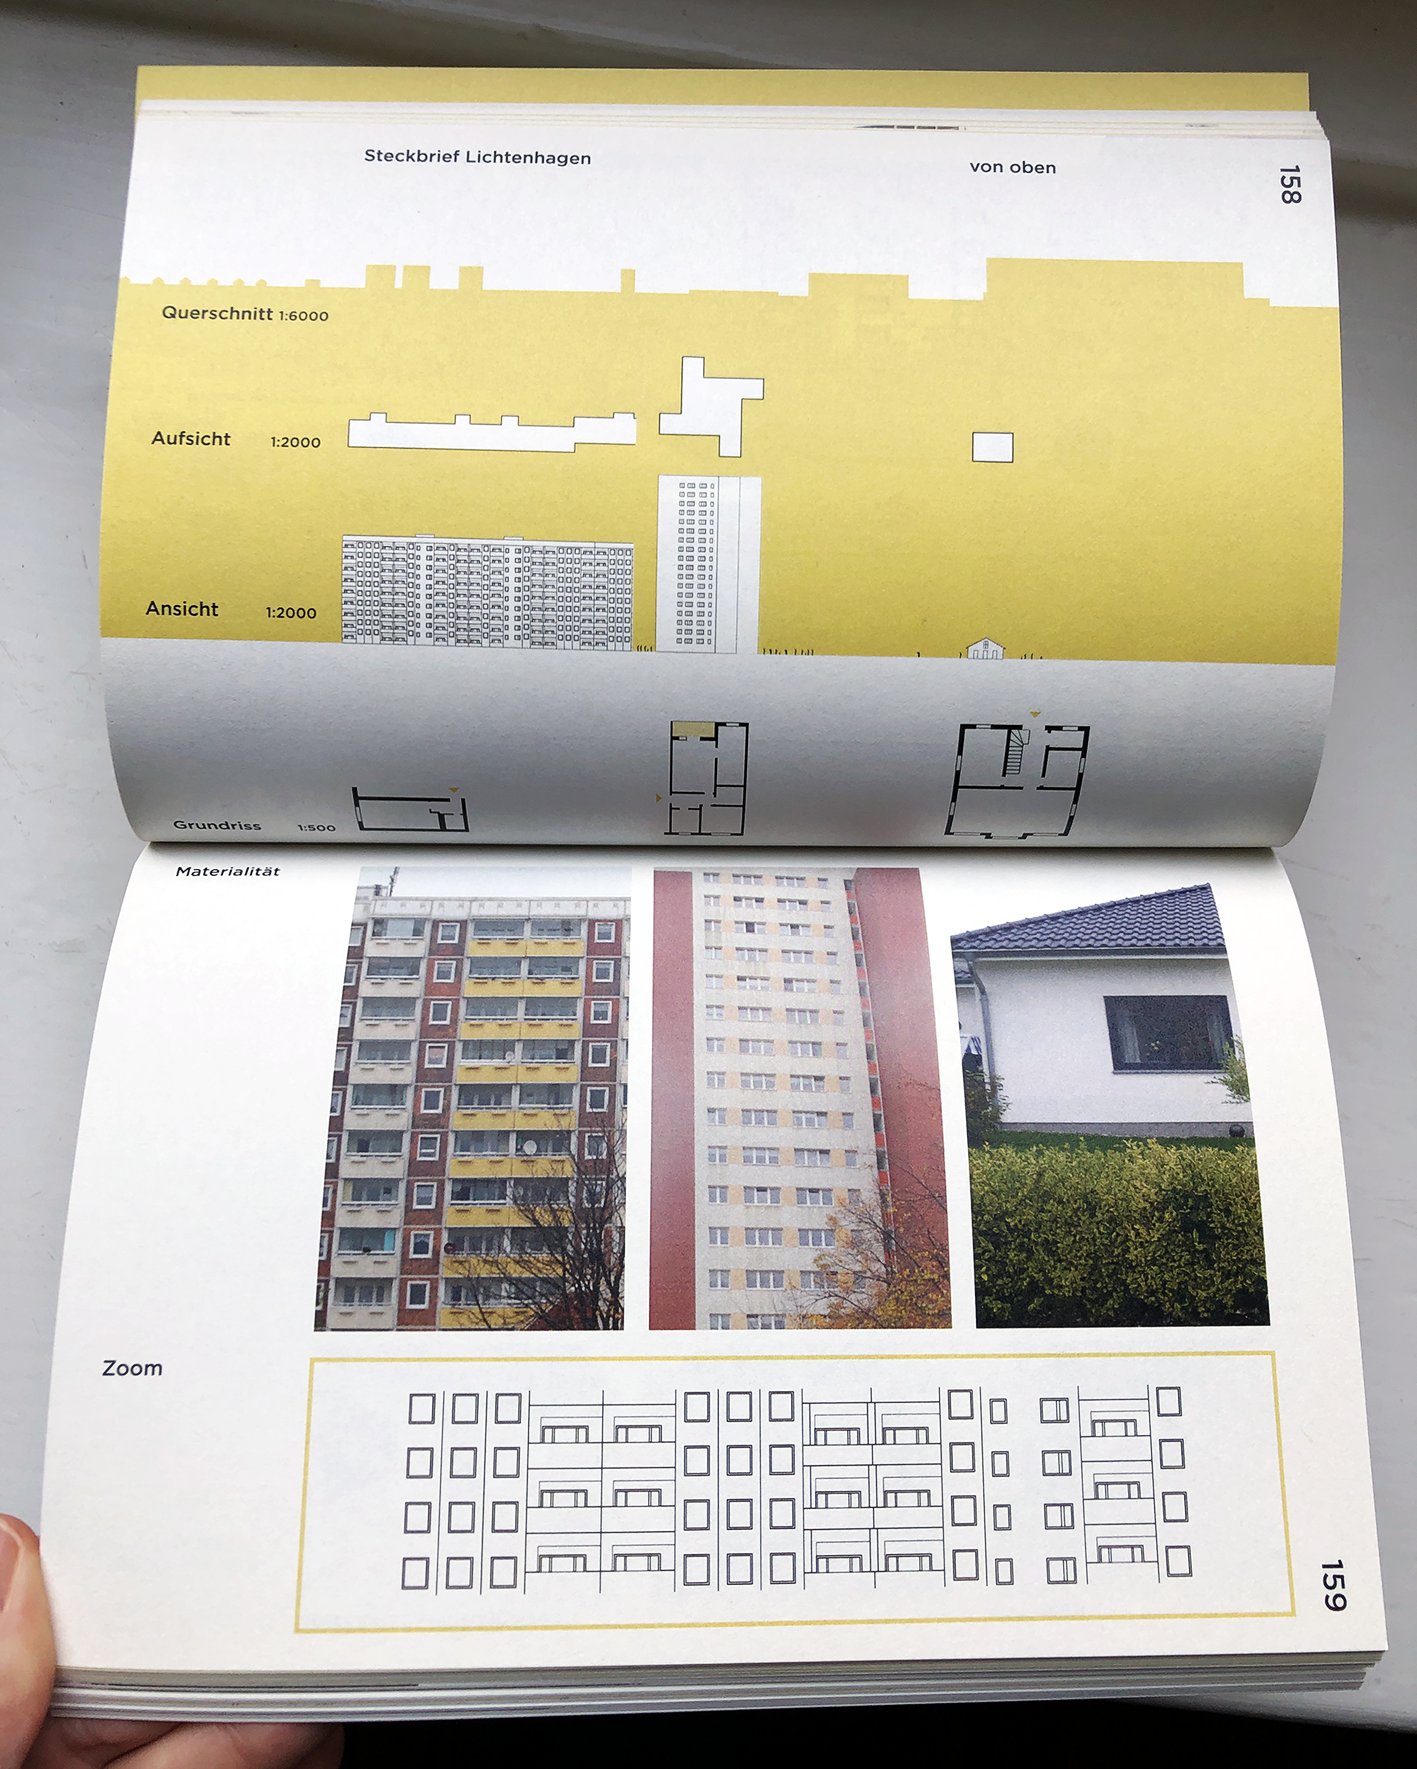
Extract from the study on Rostock's districts.


